This post is also available in:
![]() Indonesia
Indonesia ![]() Português
Português
The Candlestick pattern in Forex trading is a method of reading a price chart. To read a candlestick pattern, we have 4 data points: open, high, low, and close. This patterns can be formed across different time frames. It means if you are on the one-hour time frame every candlestick pattern will be formed every one hour, if you are on a daily time frame every candlestick pattern will be formed every day etc.
How to read Candlestick Patterns
When you are dealing with candlestick patterns you would usually see one of two candles, either it’s a green candle or a red candle, sometimes it could be black or white.

“A bull” candle and “A bear” candle
Main difference between “a bull” and “a bear” candle is the location of their opening and closing price.
For “a bull” candle it means that the market has closed above the opening price. For “a bear” candle it means that the market has closed below the opening price.
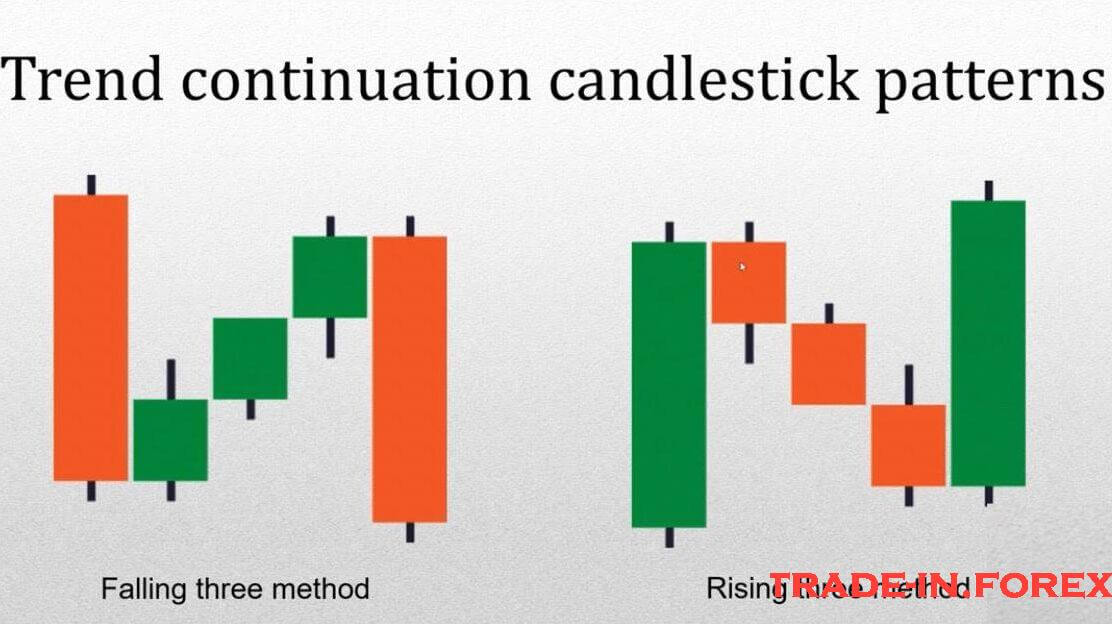
Types of Candlestick Patterns in Forex
- Bullish reversal
- Bearish reversal
- Indecision
- Trend continuation

Read How to Select Your Trade Entries: Forex Perfect Entry Guide

Read about How to Make One Million Trading

When you see it on a chart sometimes it is a little bit different.
Common mistakes

- Trading against the trend

- Trading far from an area of value
What is TAE Formula
T: Trend
- Trade in the direction of the trend
- Uptrend – Buying opportunities
- Downtrend – Selling opportunities
A: Area of value
- Uptrend: An area of on your chart where buying pressure could step in and push the price higher
- Downtrend: An area on your chart where selling could step in and push the price lower
- Support and Resistance moving average etc.
E: Entry trigger
- Candlestick patterns to act as an entry trigger